
PresentMon, an open-source performance analysis tool developed by Intel, is widely recognized for its ability to monitor and analyze the performance of graphics applications on Windows. One of its standout features is the real-time overlay, which provides live, on-screen performance metrics during application execution. This feature is invaluable for gamers, developers, and system analysts who need immediate insights into system performance. Below, we explore the key benefits of using PresentMon’s real-time overlay feature during live application execution, highlighting its practical applications, customization options, and impact on performance optimization.
Immediate Performance Feedback
The real-time overlay provides instant visibility into critical performance metrics, such as frames per second (FPS), frame time, GPU utilization, CPU busy time, and power consumption, without the need to pause or exit the application. This immediate feedback is crucial for:
Diagnosing Performance Bottlenecks: The overlay displays metrics like GPU Busy and CPUFrameTime, allowing users to identify whether the CPU or GPU is the limiting factor in real time. For example, in a game like Cyberpunk 2077, if GPU Busy time closely matches frame time, the overlay indicates a GPU-bound scenario, prompting users to adjust graphics settings like resolution or ray tracing.
Live Optimization: Gamers and developers can tweak settings (e.g., in-game graphics options or driver configurations) and observe the impact instantly. For instance, lowering texture quality might reduce GPU utilization, as shown in the overlay, improving FPS without needing post-session analysis.
Monitoring Frame Generation: With support for technologies like Intel XeFG and AMD Fluid Motion Frames, the overlay’s Displayed FPS and FrameType metrics allow users to see the impact of frame generation in real time, distinguishing between rendered and interpolated frames.
Customizable and User-Friendly Display
PresentMon’s real-time overlay is highly customizable, enabling users to tailor the displayed metrics to their specific needs. This flexibility enhances its utility across diverse use cases:
Selective Metric Display
Users can choose which metrics to display, such as FPS, frame time, GPU power, or memory usage, ensuring the overlay remains uncluttered. For example, a developer debugging a Vulkan-based application might focus on GPU Busy and msUntilRenderStart to analyze rendering delays.
Graphical Visualizations
The overlay supports multi-line graphs and histograms, making it easier to spot trends and anomalies. For instance, a histogram of frame times can reveal stuttering issues during gameplay, helping users pinpoint problematic scenes or settings.
Configurable Appearance
Users can adjust the overlay’s position, font size, and graph colors to ensure readability against different game backgrounds. This is particularly useful in fast-paced games where a poorly placed overlay might obstruct critical UI elements.
Cross-Vendor Compatibility
The overlay works seamlessly with Intel, NVIDIA, and AMD GPUs, displaying vendor-specific telemetry (e.g., Intel Arc’s effective frequency or NVIDIA’s power usage) in a unified format, making it accessible regardless of hardware.
Enhanced Debugging for Developers
For developers, the real-time overlay is a powerful tool for debugging and optimizing graphics applications during live execution:
API-Agnostic Insights
Supporting DirectX 9, 11, 12, OpenGL, and Vulkan, the overlay provides consistent metrics across APIs. Developers can monitor performance in real time, even for less-instrumented APIs like OpenGL, where metrics like CPUFrameTime might be less precise but still valuable.
Frame Delivery Analysis
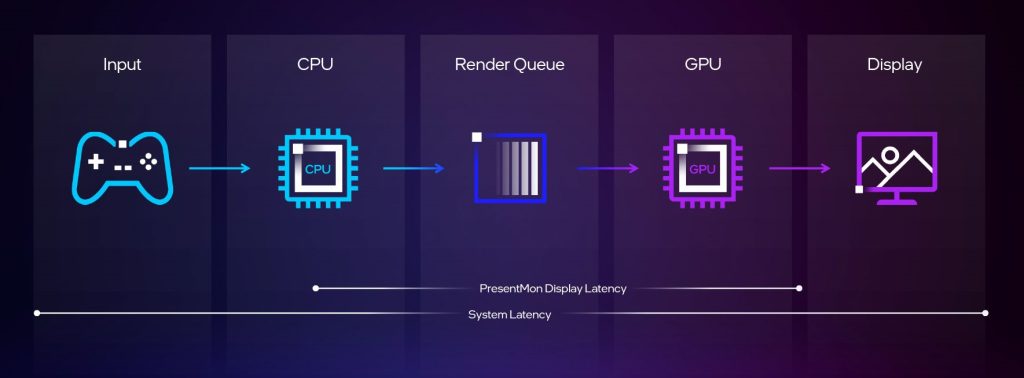
Metrics like msUntilDisplayed and msBetweenDisplay quantify frame delivery and presentation latency, helping developers identify issues in the rendering pipeline. For example, a high msUntilDisplayed value might indicate a driver or API issue, prompting further investigation.
Integration with Development Workflows
The overlay’s data can guide developers in optimizing shaders, reducing draw calls, or balancing CPU-GPU workloads during live testing, saving time compared to post-execution analysis.
Improved Gaming Experience
For gamers, the real-time overlay enhances the gaming experience by providing actionable insights without interrupting gameplay:
Real-Time Performance Tuning
Gamers can adjust settings like resolution, anti-aliasing, or V-Sync and immediately see the impact on FPS or GPU utilization. For instance, in a game like Escape From Tarkov, the overlay might reveal a CPU bottleneck (high CPUFrameTime relative to GPU Busy), prompting users to lower CPU-intensive settings like shadow quality.
Monitoring System Stability
The overlay’s power and temperature metrics help gamers monitor GPU health during extended sessions, preventing overheating or throttling. For example, Intel Arc users can track voltage regulator temperatures to ensure stable performance.
Competitive Advantage
In competitive gaming, where every frame counts, the overlay helps players optimize settings for maximum FPS and minimal latency, ensuring smoother gameplay in titles like Valorant or CS:GO.
Non-Intrusive Performance Monitoring
PresentMon’s real-time overlay is designed to minimize its impact on system performance, ensuring accurate metrics without compromising the application’s execution:
Low Overhead
The overlay is lightweight, typically consuming minimal CPU resources (though some users report 10-18% CPU usage in rare cases, such as with non-gaming applications). This ensures that the metrics reflect the application’s true performance, not artifacts introduced by the monitoring tool.
No Administrator Privileges Required
Since version 2.3.1, PresentMon runs without administrator privileges, making it easier to deploy and use during live execution, even on restricted systems.
Seamless Integration
The overlay activates automatically when PresentMon is launched, requiring no complex setup. Users can toggle it on or off during gameplay, ensuring it doesn’t interfere when not needed.
Support for Advanced Use Cases
The real-time overlay caters to advanced users, such as tech reviewers and system benchmarkers, by providing detailed metrics for in-depth analysis:
Benchmarking and Comparisons
Reviewers can use the overlay to compare performance across different GPUs (e.g., Intel Arc vs. NVIDIA GeForce) or APIs (e.g., DX12 vs. Vulkan) in real time, streamlining the benchmarking process.
Frame Pacing Analysis
The overlay’s frame time graphs and histograms help identify frame pacing issues, such as micro-stuttering, which are critical for smooth gameplay and VR applications.
Cross-Application Monitoring
Beyond gaming, the overlay can monitor non-gaming applications like 3D rendering software or video editing tools, providing insights into GPU utilization and performance across diverse workloads.
Complementary to Post-Analysis
While the real-time overlay is designed for live monitoring, it complements PresentMon’s data capture capabilities, enhancing its overall utility:
Immediate Validation
Users can use the overlay to spot issues during live execution and then capture data to CSV files for detailed post-analysis. For example, if the overlay shows sporadic FPS drops, users can analyze the corresponding CSV data to identify the root cause.
Iterative Optimization
The overlay allows users to test changes in real time, while captured data provides a comprehensive view of performance trends, enabling iterative optimization during development or gameplay.
Limitations and Considerations
While the real-time overlay is highly effective, there are a few considerations to keep in mind:
Potential for Overlay Conflicts
In rare cases, the overlay may stick to the wrong window or fail to display correctly with games using dedicated launchers. Launching PresentMon after the game can resolve this.
Accuracy with Certain APIs
Metrics for OpenGL or Vulkan applications may be less precise due to API limitations, though the overlay still provides valuable real-time insights.
Hardware-Accelerated GPU Scheduling (HWS)
When HWS is enabled, some metrics (e.g., msGPUActive) may be less accurate, affecting the overlay’s precision. Disabling HWS can improve accuracy for critical debugging.
FAQ’s
What metrics does PresentMon’s real-time overlay display during live application execution?
The overlay shows FPS, frame time, GPU Busy, CPUFrameTime, GPU utilization, power consumption, and frame generation metrics like Displayed FPS, customizable to user needs.
How does the real-time overlay help gamers optimize performance?
It provides instant feedback on bottlenecks (CPU or GPU), allowing gamers to adjust settings like resolution or V-Sync in real time to improve FPS and reduce latency.
Can developers use the real-time overlay for debugging?
Yes, developers can monitor metrics like msUntilDisplayed and msBetweenDisplay to debug rendering pipelines across DirectX, OpenGL, and Vulkan APIs during live execution.
Is the real-time overlay compatible with all GPUs?
Yes, it supports Intel, NVIDIA, and AMD GPUs, displaying vendor-specific telemetry like Intel Arc’s effective frequency or NVIDIA’s power usage in a unified format.
Does the real-time overlay impact system performance?
The overlay is lightweight with minimal CPU usage (typically under 10%), though rare cases may see higher loads (10-18%) in non-gaming applications.
Can the real-time overlay be customized for different use cases?
Yes, users can select metrics, adjust overlay position, font size, and graph colors, and use multi-line graphs or histograms for tailored performance monitoring.
Conclusion
PresentMon’s real-time overlay feature is a game-changer for performance analysis during live application execution. Its ability to provide immediate, customizable, and low-overhead feedback empowers gamers to optimize their experience, developers to debug applications, and reviewers to benchmark systems effectively. With support for multi-vendor GPUs (Intel, NVIDIA, AMD) and multiple APIs (DirectX, OpenGL, Vulkan), the overlay delivers versatile and actionable insights. Whether you’re fine-tuning a game for competitive play, debugging a graphics pipeline, or comparing hardware performance, PresentMon’s real-time overlay is an indispensable tool for real-time performance monitoring.